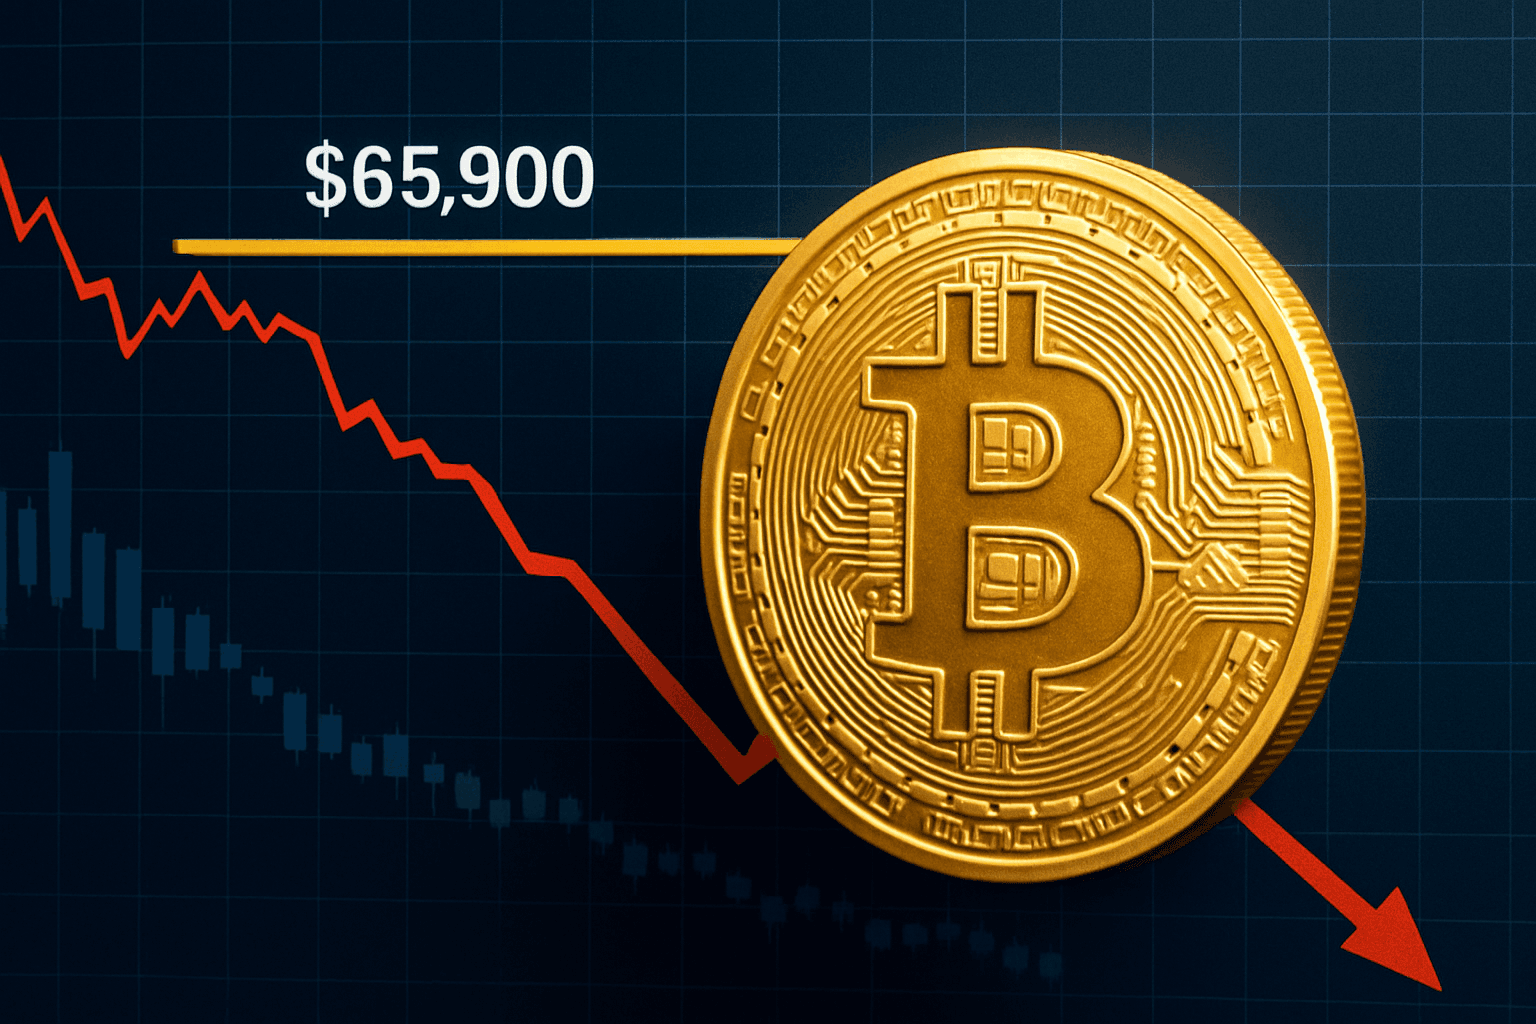
Bitcoin slips from three-week high as inflation boost fades near $65,900 resistance
Bitcoin rose on softer U.S. inflation and rate-cut hopes but fell back below $64,500 as tech stocks weakened and traders flagged technical resistance near anchored VWAP and the 50-month EMA.
Bitcoin briefly rebounded to about $63,921 and then to three-week highs before slipping roughly 1.5% to around $64,500 on Thursday, as softer-than-expected U.S. inflation data lifted hopes that the Federal Reserve could ease monetary policy but weakening technology stocks cooled the broader risk rally. Market participants said the move was driven mainly by macroeconomic sentiment rather than crypto-specific catalysts. Traders also highlighted technical resistance, with Exitpump pointing to anchored VWAP tied to Bitcoin’s move to $82,000 in early May and Rekt Capital citing the 50-month exponential moving average near $65,900 as a level where the rebound was showing signs of rejection.
- anchored VWAP: A volume-weighted average price indicator set from a specific starting point to track potential support or resistance.
- 50-month exponential moving average: A long-term trend indicator that smooths price data over 50 months to identify resistance or support.
- risk appetite: Investor willingness to buy riskier assets.